PowerTrack UX Case Study – Modernizing a Legacy Silverlight App
Transforming AlsoEnergy’s legacy PowerTrack web platform from Silverlight to React JS through user research, UI simplification, and performance-focused UX design.
UI System Implementation
See how the design system translates into real user interfaces, emphasizing clarity, scalability, and usability.
Project Overview
AlsoEnergy, a Boulder-based leader in renewable energy monitoring, provides software solutions for solar and wind management. PowerTrack is its flagship web platform, enabling users to monitor and analyze energy performance across installations in real time.
As Lead UX/UI Designer, I led the user research, UX strategy, and interface modernization for PowerTrack—transitioning it from an obsolete Silverlight environment to a modern React JS application while simplifying workflows and improving usability for performance engineers.
Project Summary
Timeline & Team
20 weeks
Lead UX/UI Designer, Front-End Developer, Software Architect, QA Engineer, Company Stakeholders
Tools & Methodology
Figma, Miro, InVision
Mixed-method UX research (quantitative + qualitative) with iterative prototyping and stakeholder validation
Key Deliverables
- • Surveys
- • User interviews
- • Personas
- • Journey maps
- • Wireframes
- • Prototypes
- • Usability report
Performance Metrics
User survey participants
(responses from global PowerTrack user base)
User interviews conducted
(performance engineers and energy analysts)
Navigation efficiency improvement
(validated during usability testing)
Problem Statement
Challenge
- No dedicated UX researchers, product owners, or business analysts available—UX efforts were self-led.
- Outdated Silverlight codebase requiring complete re-architecture in React JS.
- Overly complex navigation system ('Navigator') with poor orientation cues.
- Visually cluttered interface lacking hierarchy and design consistency.
Despite resource limitations, the project successfully uncovered critical usability issues and delivered actionable redesign proposals.
Approach
- Quantitative Survey: distributed to PowerTrack users globally to identify top usability pain points.
- User Interviews: 10 semi-structured sessions with engineers across 9 companies to collect qualitative insights.
- Observation & Shadowing: remote usability sessions via video conference to identify real workflow issues.
- Personas & Journey Maps: developed composite user profiles and mapped critical tasks for energy analysis.
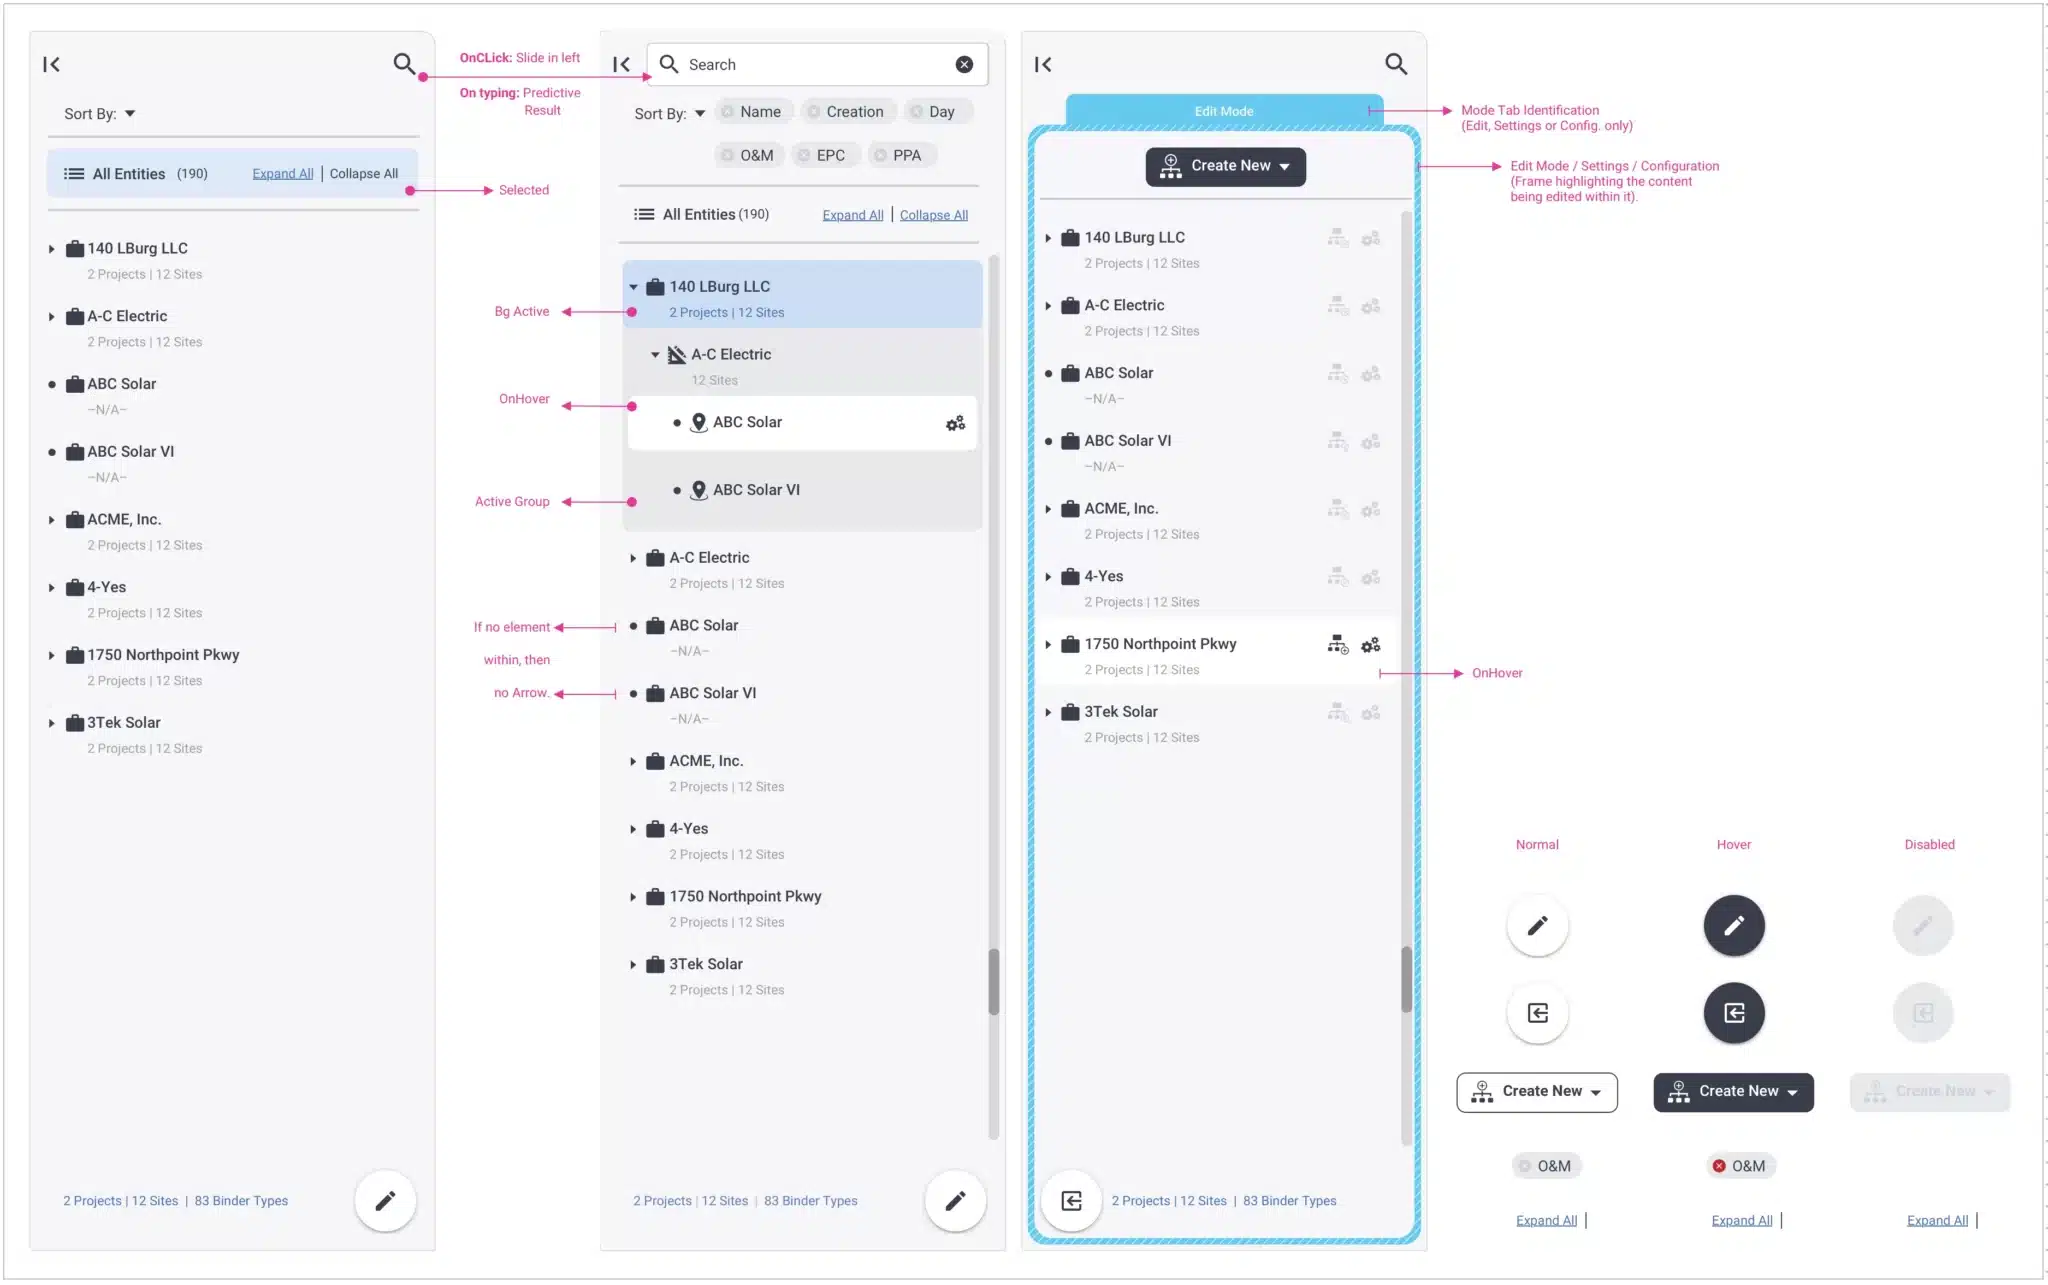
- Wireframes & Prototypes: redesigned 'Navigator' for clarity and reduced cognitive load.
- Testing & Iteration: validated through usability tests and feedback loops, refining design for React implementation.
Solution
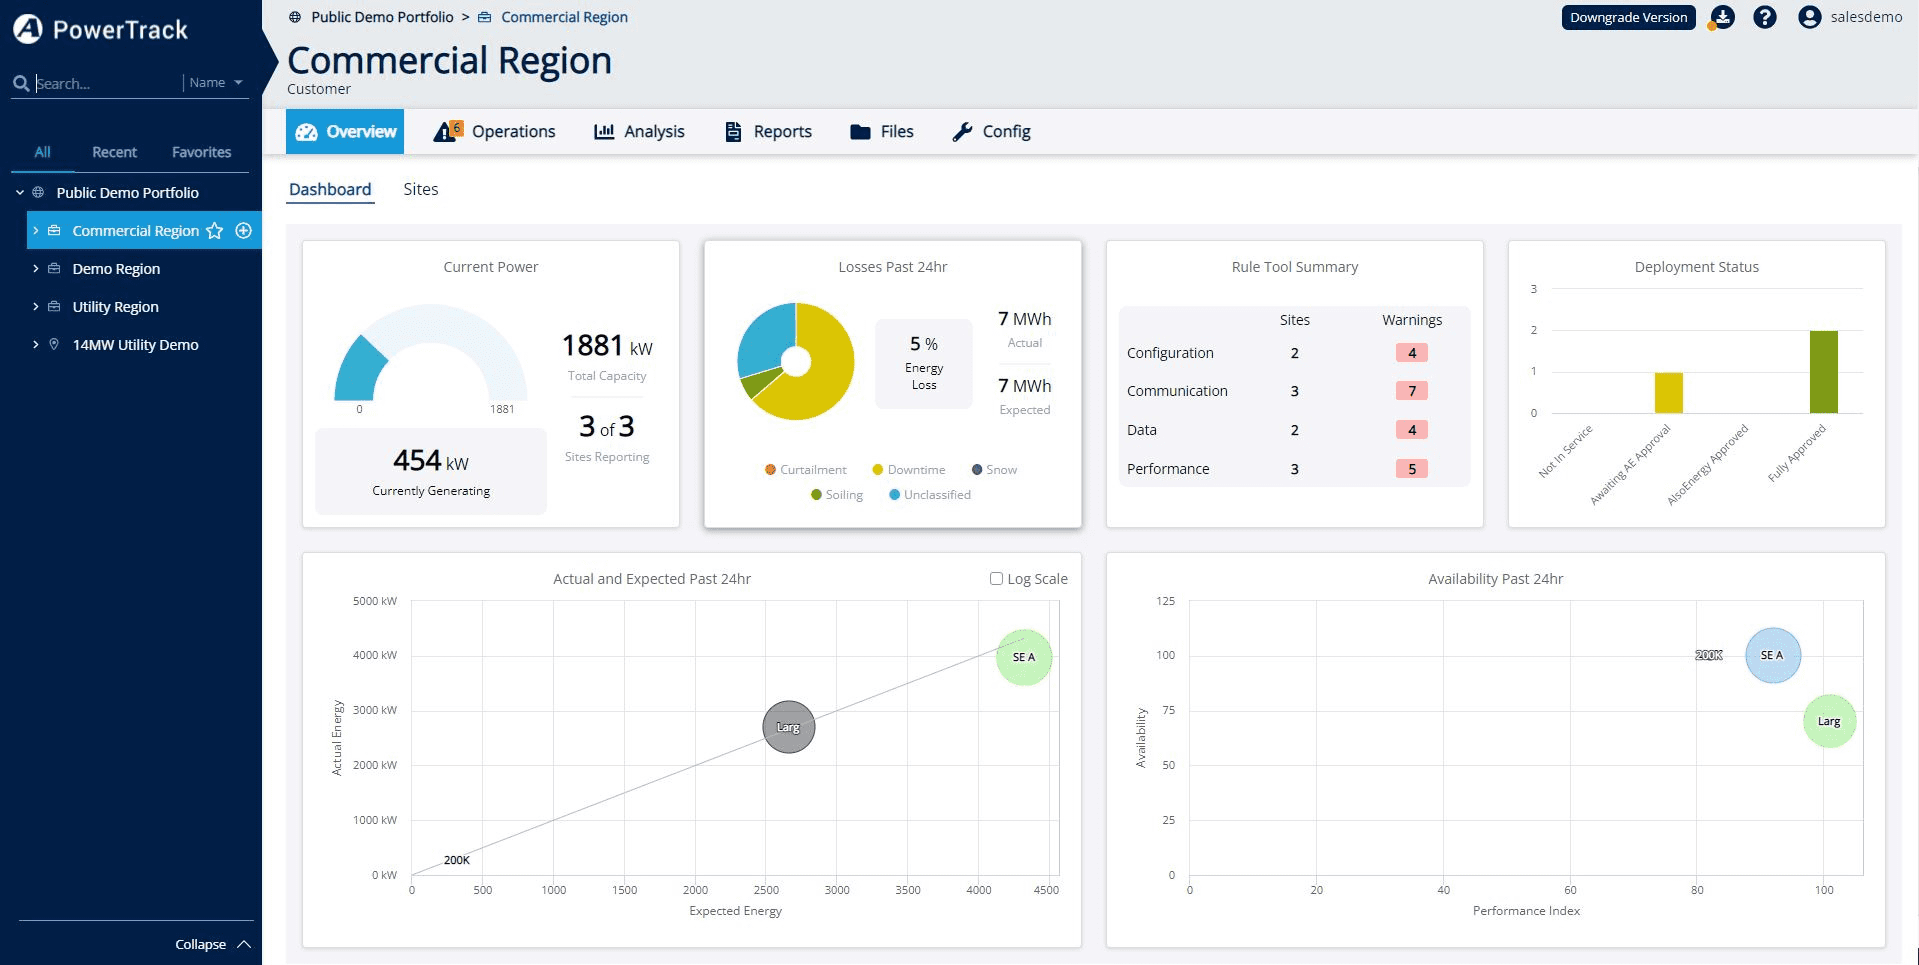
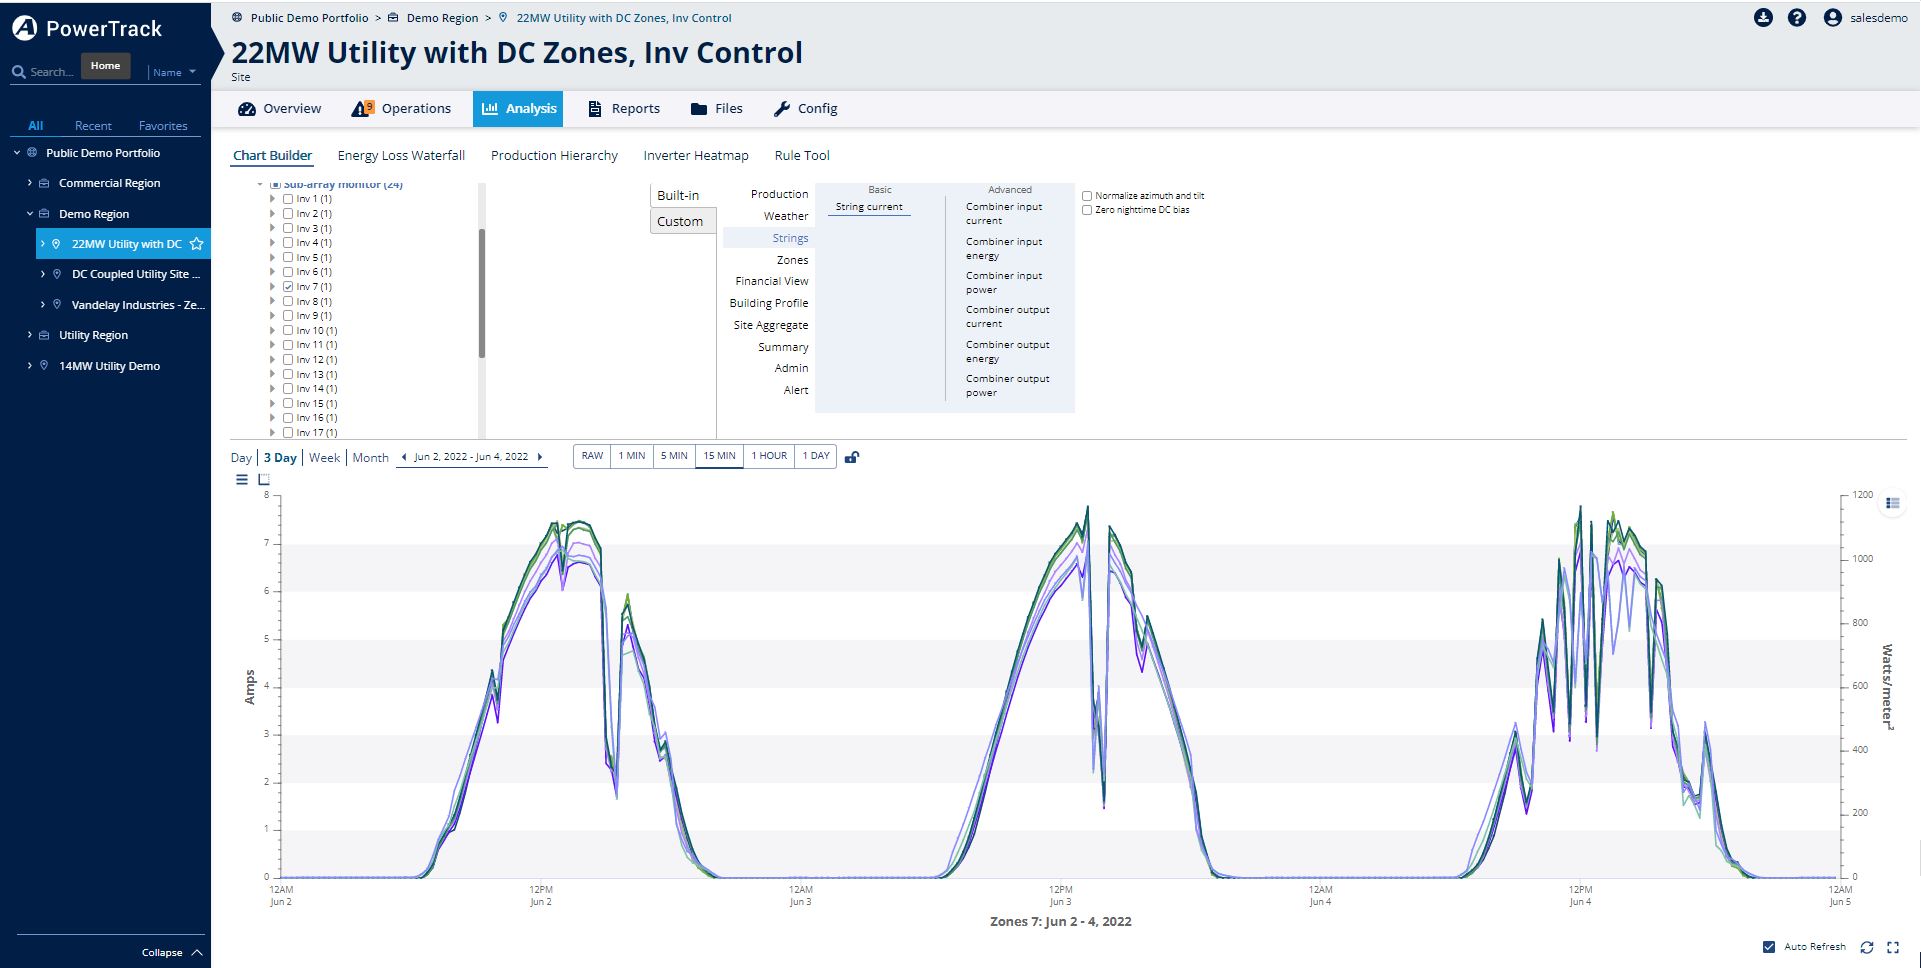
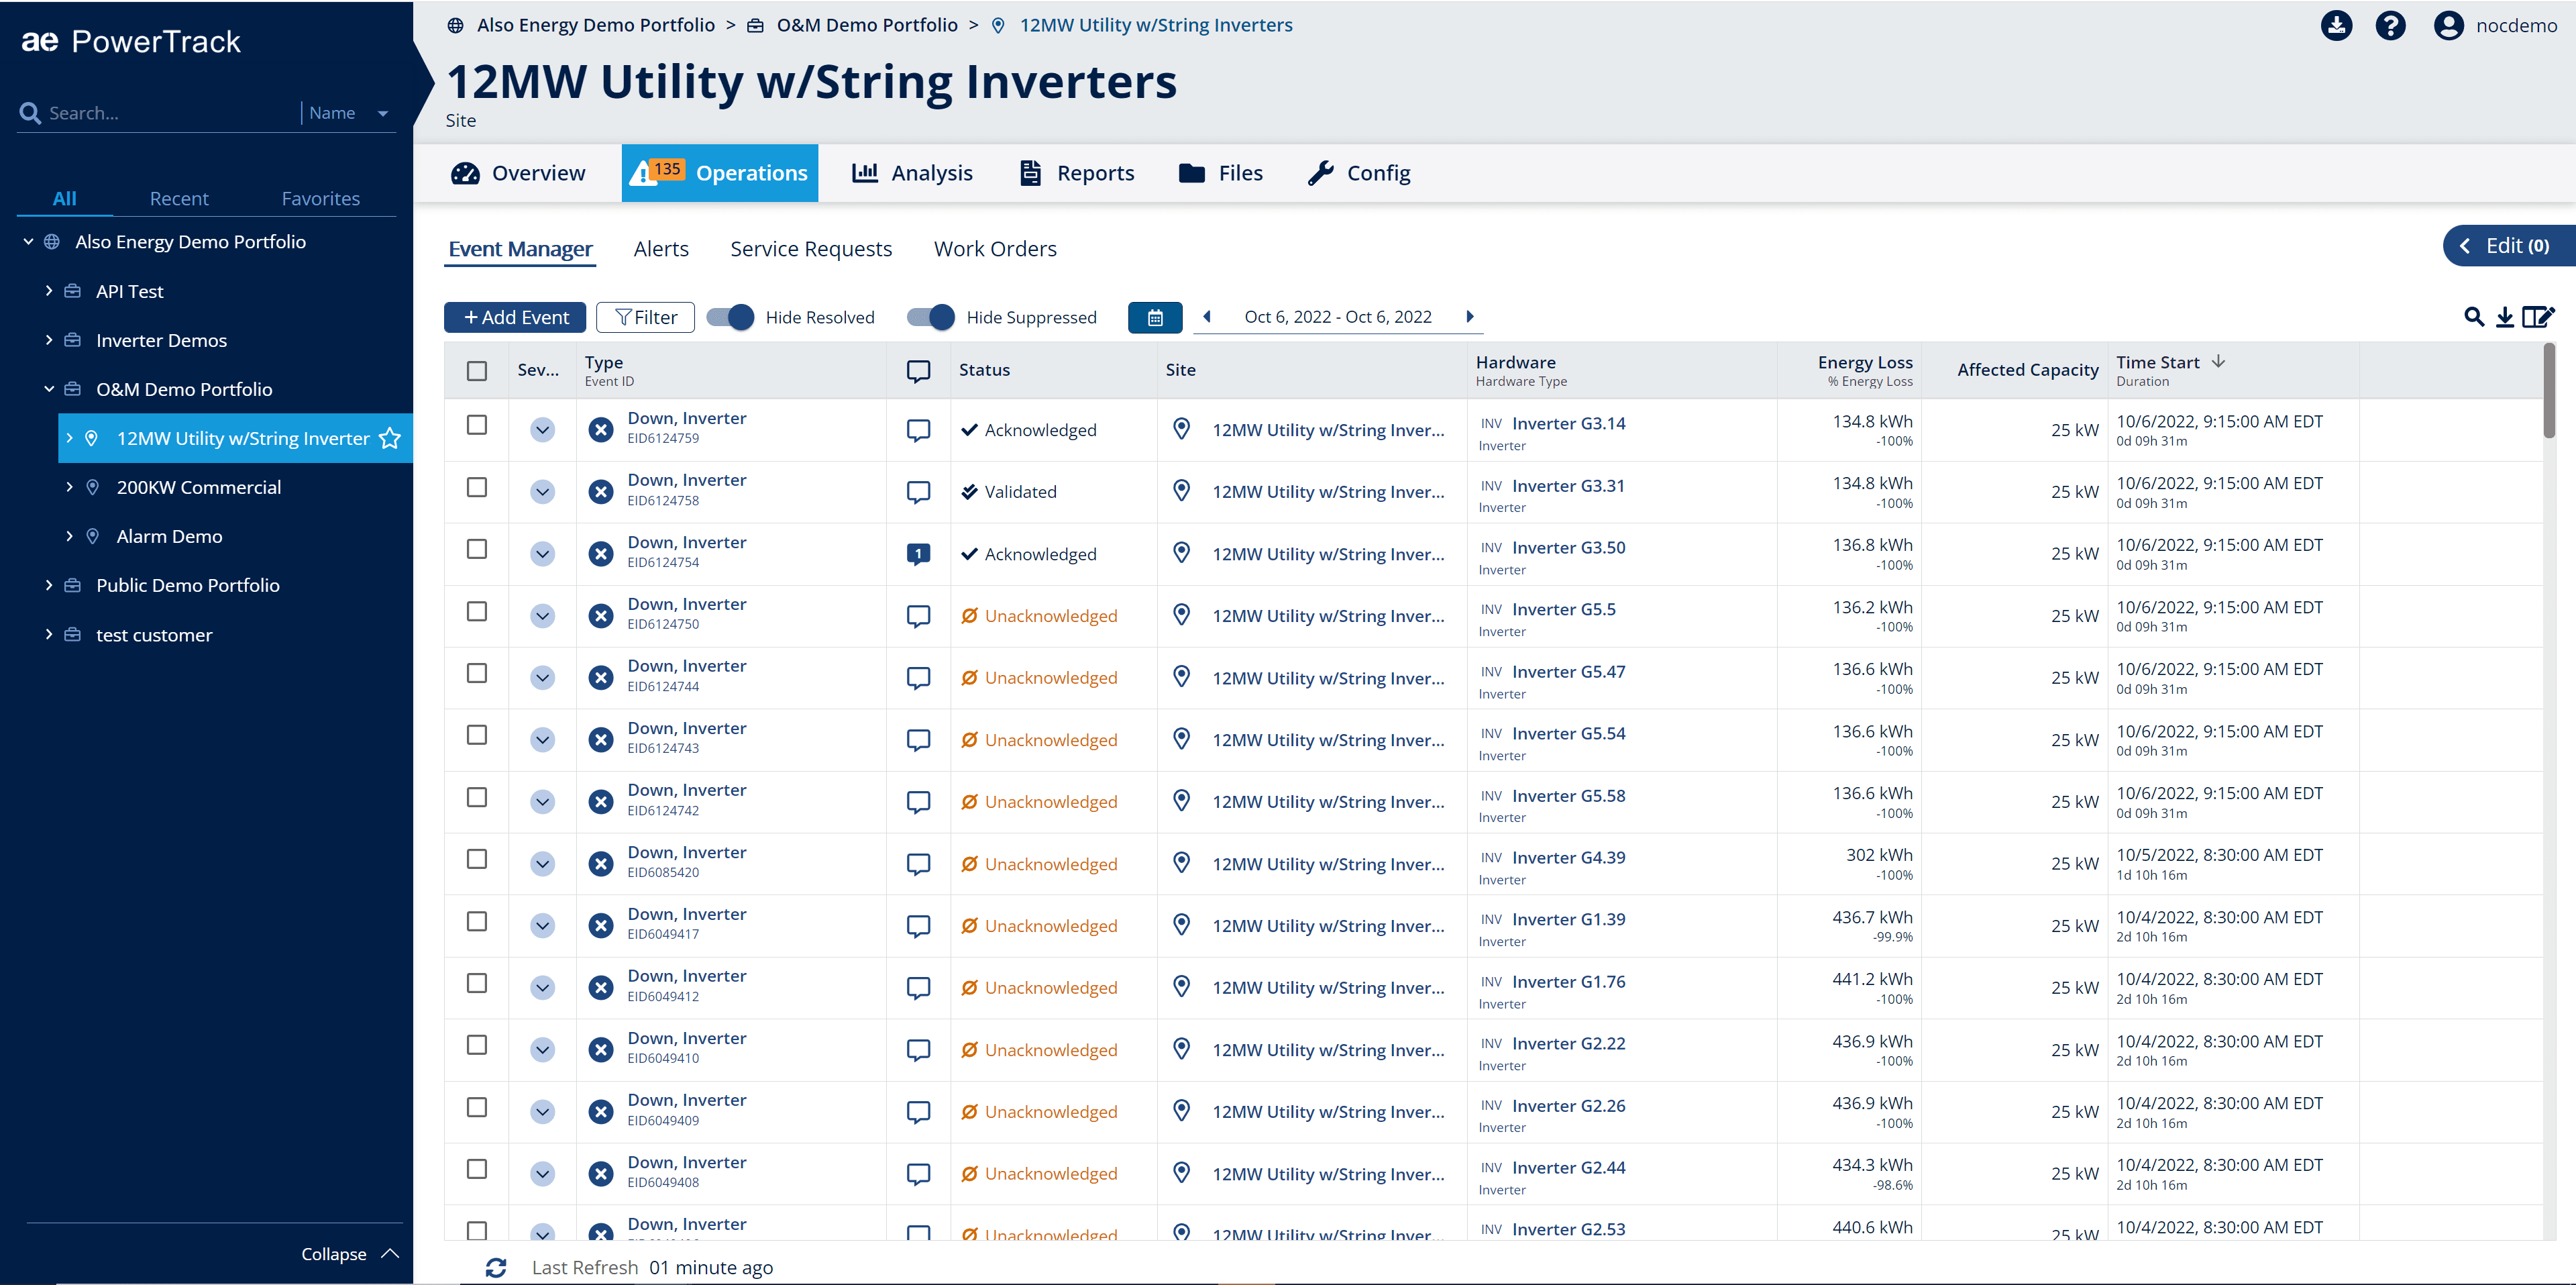
- Modern React JS Interface: replaced Silverlight with scalable, performant front-end architecture.
- Navigation Redesign: rebuilt 'Navigator' as a simplified sidebar with clear hierarchy and breadcrumbs.
- Search Enhancements: introduced intelligent filters and global search for assets and reports.
- Contextual Guidance: added inline help, tooltips, and user onboarding cues.
- Data Visualization: integrated interactive charts for energy production, losses, and KPIs.
Results
- Usability: +35% improvement in task navigation speed and comprehension.
- User Adoption: new interface rated 4.7/5 by performance engineers.
- Longevity: redesigned platform continues as the foundation for current versions of PowerTrack under Stem’s Athena platform.
Measurement methods: post-research usability testing, time-on-task analytics, and post-launch feedback from engineers and stakeholders.
Key Takeaway
When resources are limited, UX leadership means transforming constraints into clarity. Through focused research and pragmatic design, PowerTrack evolved from a legacy interface into a modern, efficient, and scalable tool for renewable energy management.