AlsoEnergy PowerNOC — Network Operations Center Platform
UX Strategy, Heuristic Evaluation & Wireframe Architecture for Renewable Energy Monitoring
Heuristic Analysis & Structural Design
This phase defined RemoteVision's UX architecture through heuristics, stakeholder input, and journey mapping. The findings shaped the IA and Balsamiq wireframes refined in FigJam, producing a validated structure ready for UI implementation.
Project Overview
PowerNOC is AlsoEnergy's Network Operations Center (NOC) platform — a system used by operations teams to monitor solar and renewable energy performance, detect anomalies, triage faults, and coordinate on-site resolutions across large national portfolios.
A NOC in this context is a centralized hub where engineers and analysts supervise energy assets in real time, track production health, respond to system alerts, and maintain service-level commitments.
PowerNOC was originally developed for internal use by AlsoEnergy's own monitoring and support operations, serving multiple large customer portfolios across the U.S. The long-term vision was to evolve it into a white-label commercial product that other energy providers and monitoring centers could deploy for their own fleets.
My role focused on building the foundational UX strategy, conducting a comprehensive heuristic evaluation, restructuring workflows, and designing the wireframe architecture that later guided internal engineers through implementation. The platform was ultimately adopted internally, with my UX framework serving as the core structure for the operational rollout.
Project Summary
Timeline & Team
2016-2019
UX Strategist & Researcher, Engineering Team, AlsoEnergy Operations Analysts
Tools & Methodology
Balsamiq Mockups, Figma, Sketch
Heuristic evaluation (Nielsen + cognitive load principles), workflow mapping, information architecture restructuring, wireframing, data grouping and priority mapping, design recommendations
Key Deliverables
- • Comprehensive heuristic evaluation report
- • Workflow maps for fault detection and triage
- • Restructured information architecture
- • Wireframe architecture for dashboards, fault lists, operator workflows, and analytics
- • Design recommendations and implementation guidelines
Performance Metrics
Improved clarity and prioritization of critical alerts
(validated via internal operator feedback)
Estimated reduction in triage effort
(based on heuristic comparison vs. legacy workflows)
Transition to collaborative monitoring
(implemented in multi-screen NOC environment)
Problem Statement
The legacy monitoring workflow at AlsoEnergy relied on a single-operator desktop tool that was never designed for collaborative, real-time operations. As monitoring portfolios grew, this individual-use model became a bottleneck: data visibility was limited to one screen, alerts were difficult to prioritize, and no shared situational awareness existed across a team.
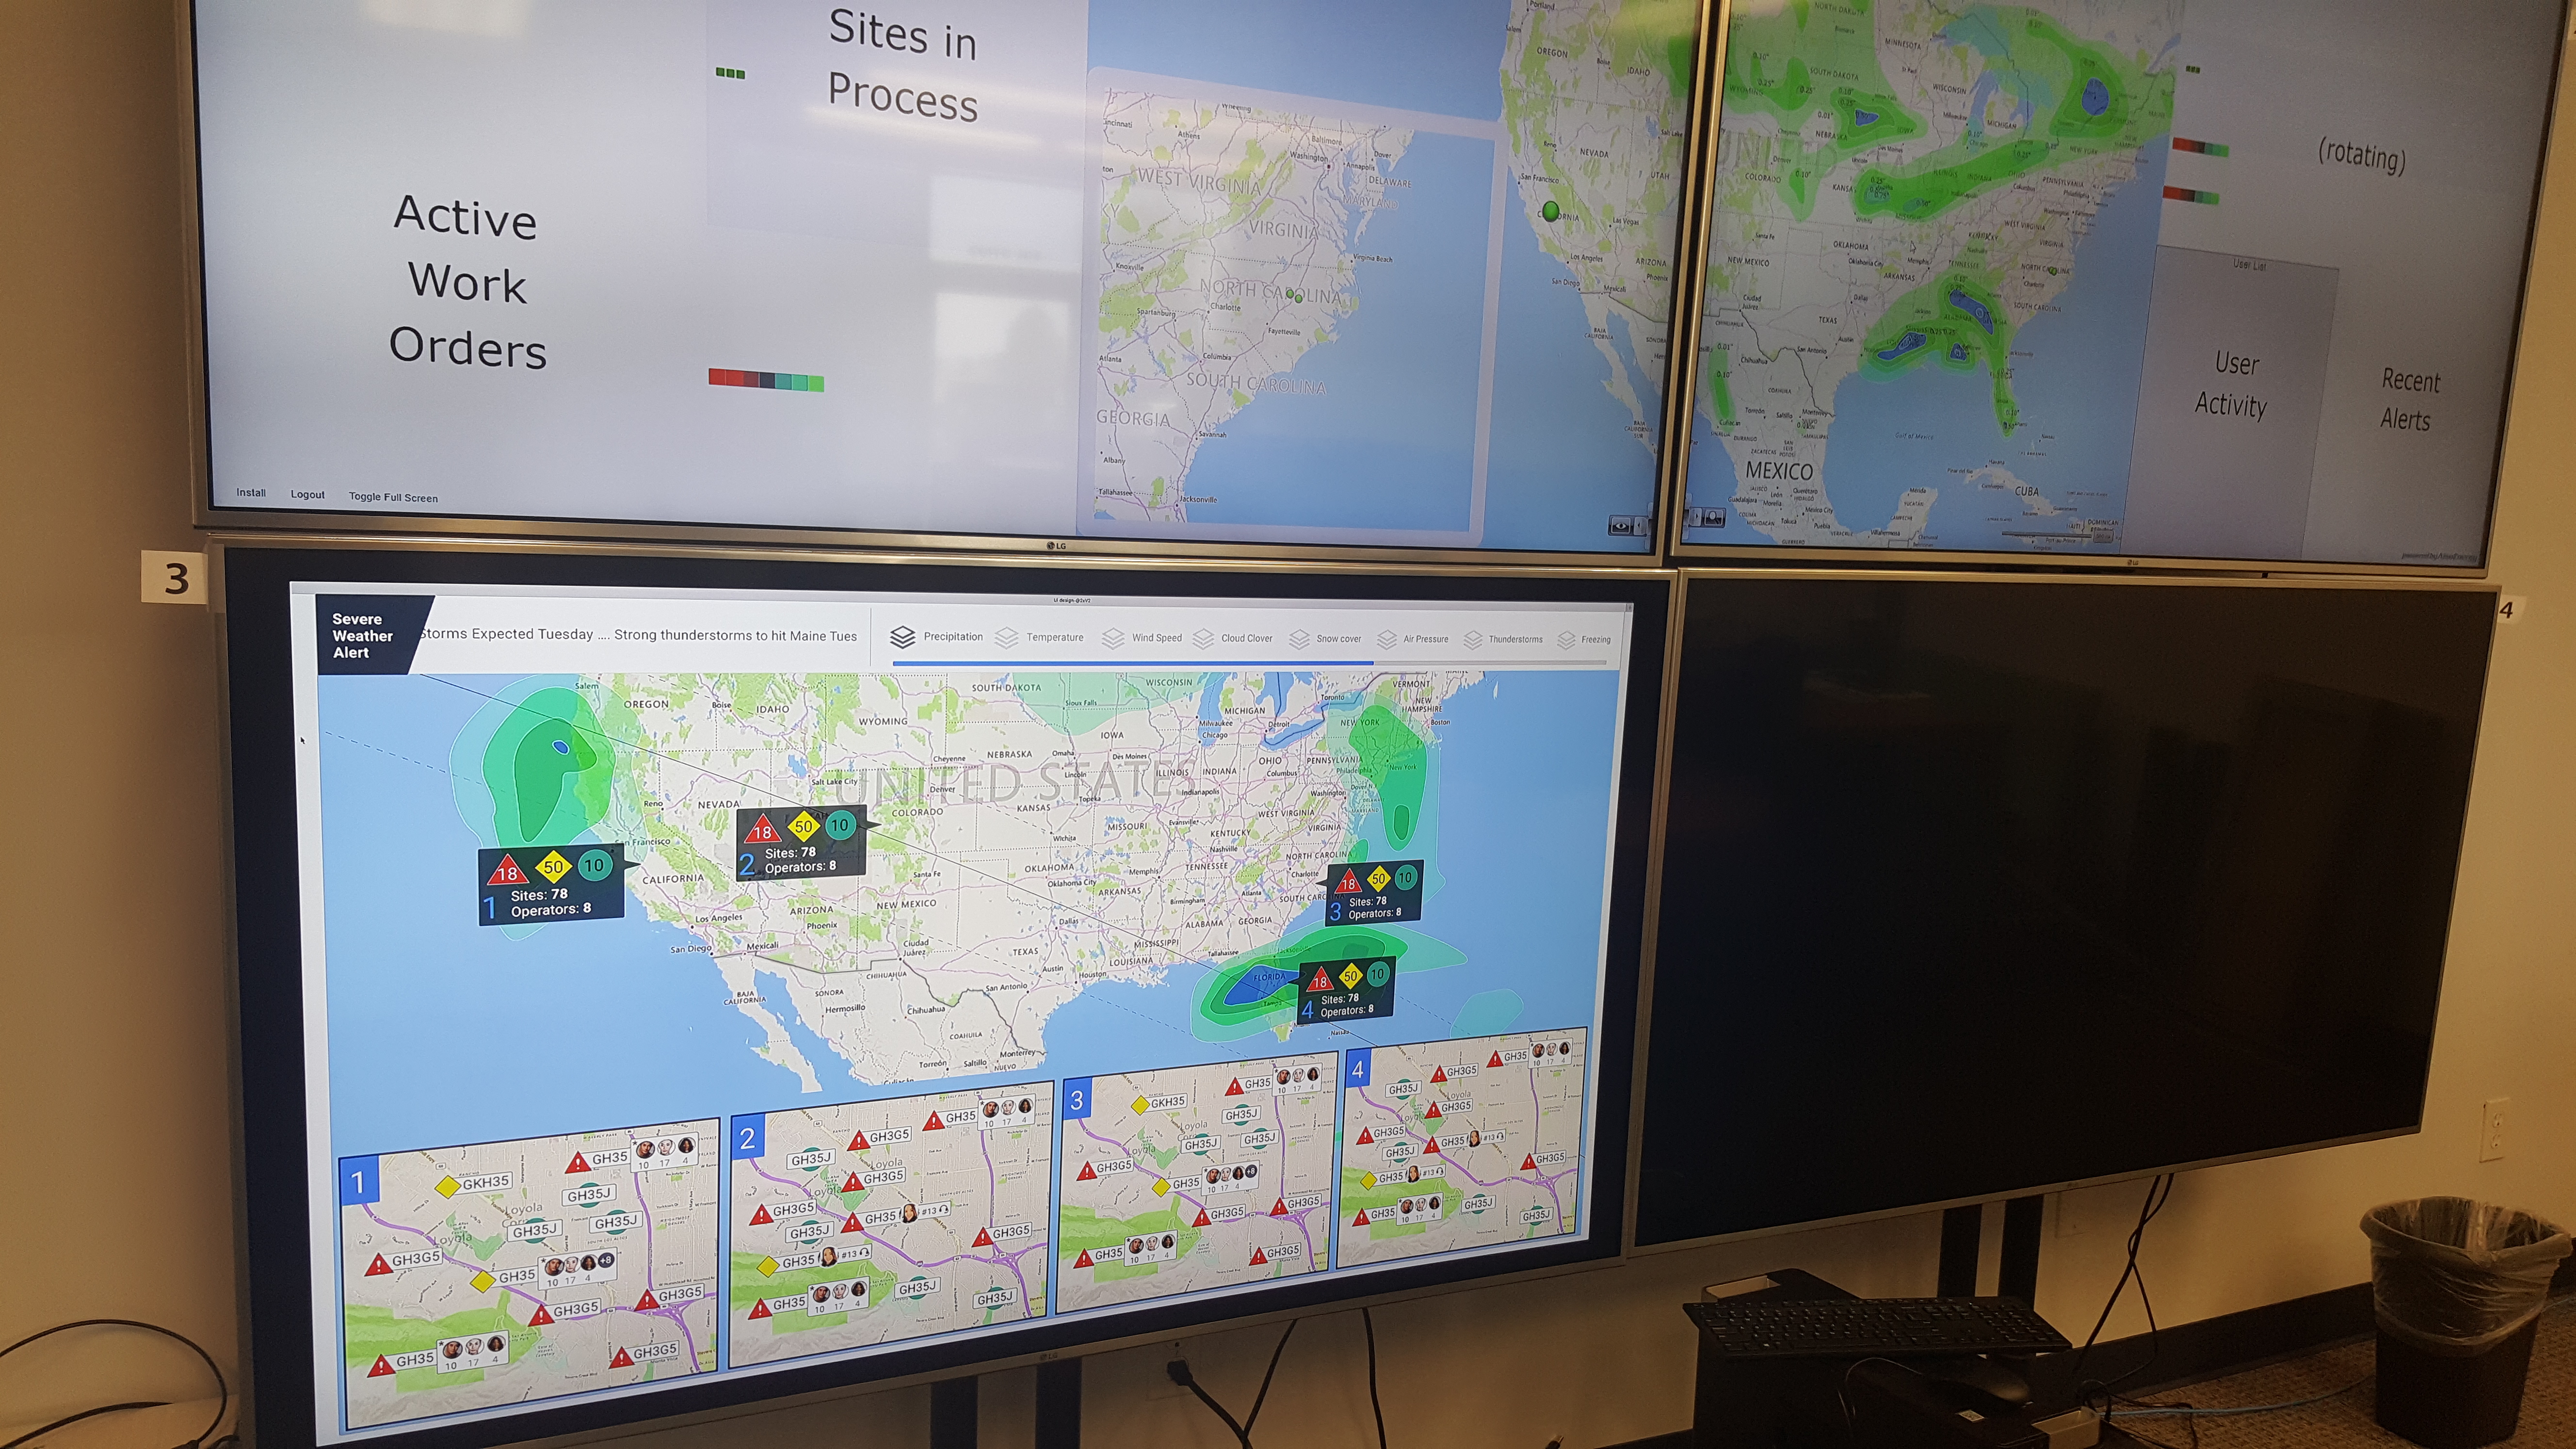
The company needed a modern Network Operations Center (NOC) platform that could scale to large physical environments—multiple 75"+ displays, multi-screen layouts, modular widgets, and configurable views tailored per portfolio. The challenge was shifting from a private, individual workstation to a collective, room-scale system where multiple operators could work together, monitor events in parallel, and maintain a shared understanding of system status.
Challenge
PowerNOC needed to evolve from a single-operator legacy tool into a scalable, room-scale NOC platform capable of supporting collaborative monitoring environments. The challenge was to design a system that could:
- Function across multi-screen layouts (4+ displays, 75"+ wall monitors) with clear shared visibility.
- Provide a low-cognitive-load interface for teams triaging faults simultaneously.
- Offer modular widgets and configurable panels adaptable to different portfolios and operational models.
- Standardize patterns for tables, charts, prioritization, filtering, and multi-panel overview states.
- Serve as the UX foundation for future white-label versions across partner organizations.
- Remain feasible for a small engineering team to implement without over-engineering.
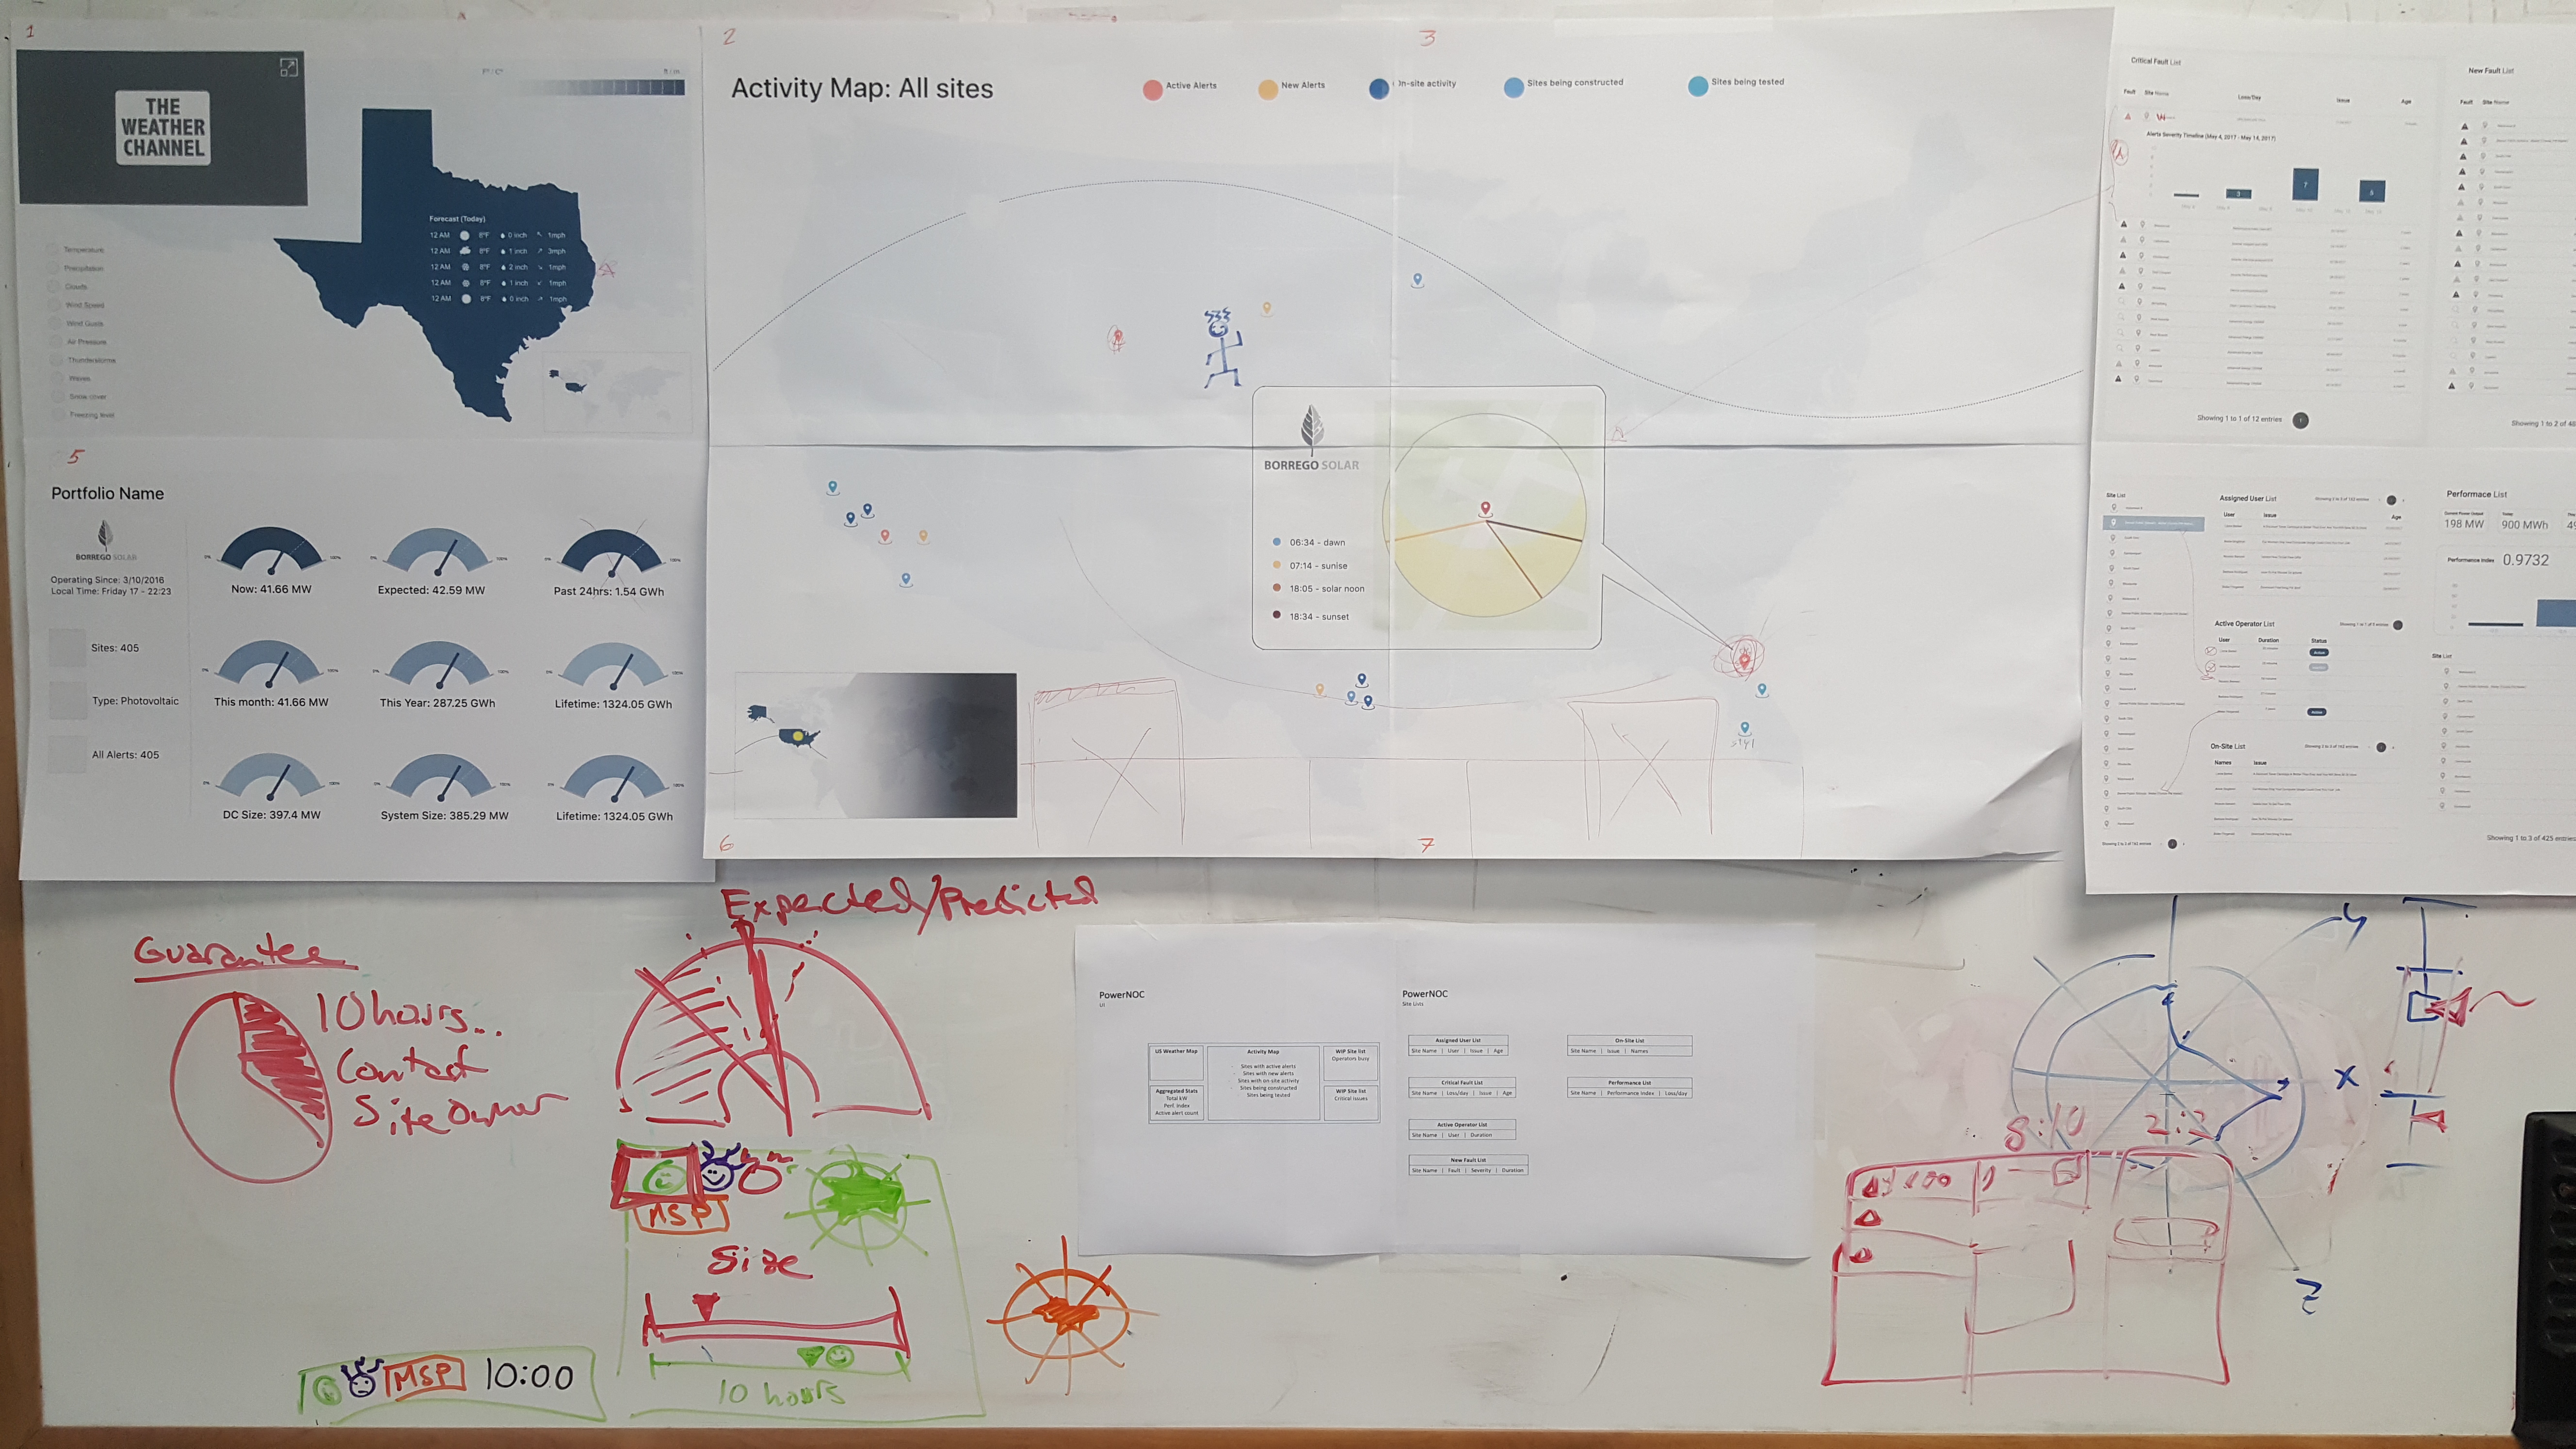
Approach
The UX foundation was built from the ground up through:
- Domain Modeling of NOC workflows, including monitoring routines, alert triage, operator coordination, and escalation patterns.
- Operational Mapping of how multi-person NOC teams collaborate across large multi-screen environments.
- Conceptual Information Architecture defining modules, hierarchy, shared panels, and scalable widget zones.
- Layout Systems for multi-display setups, enabling consistent grid logic across 75"+ monitors, 4-screen walls, and single-operator fallback views.
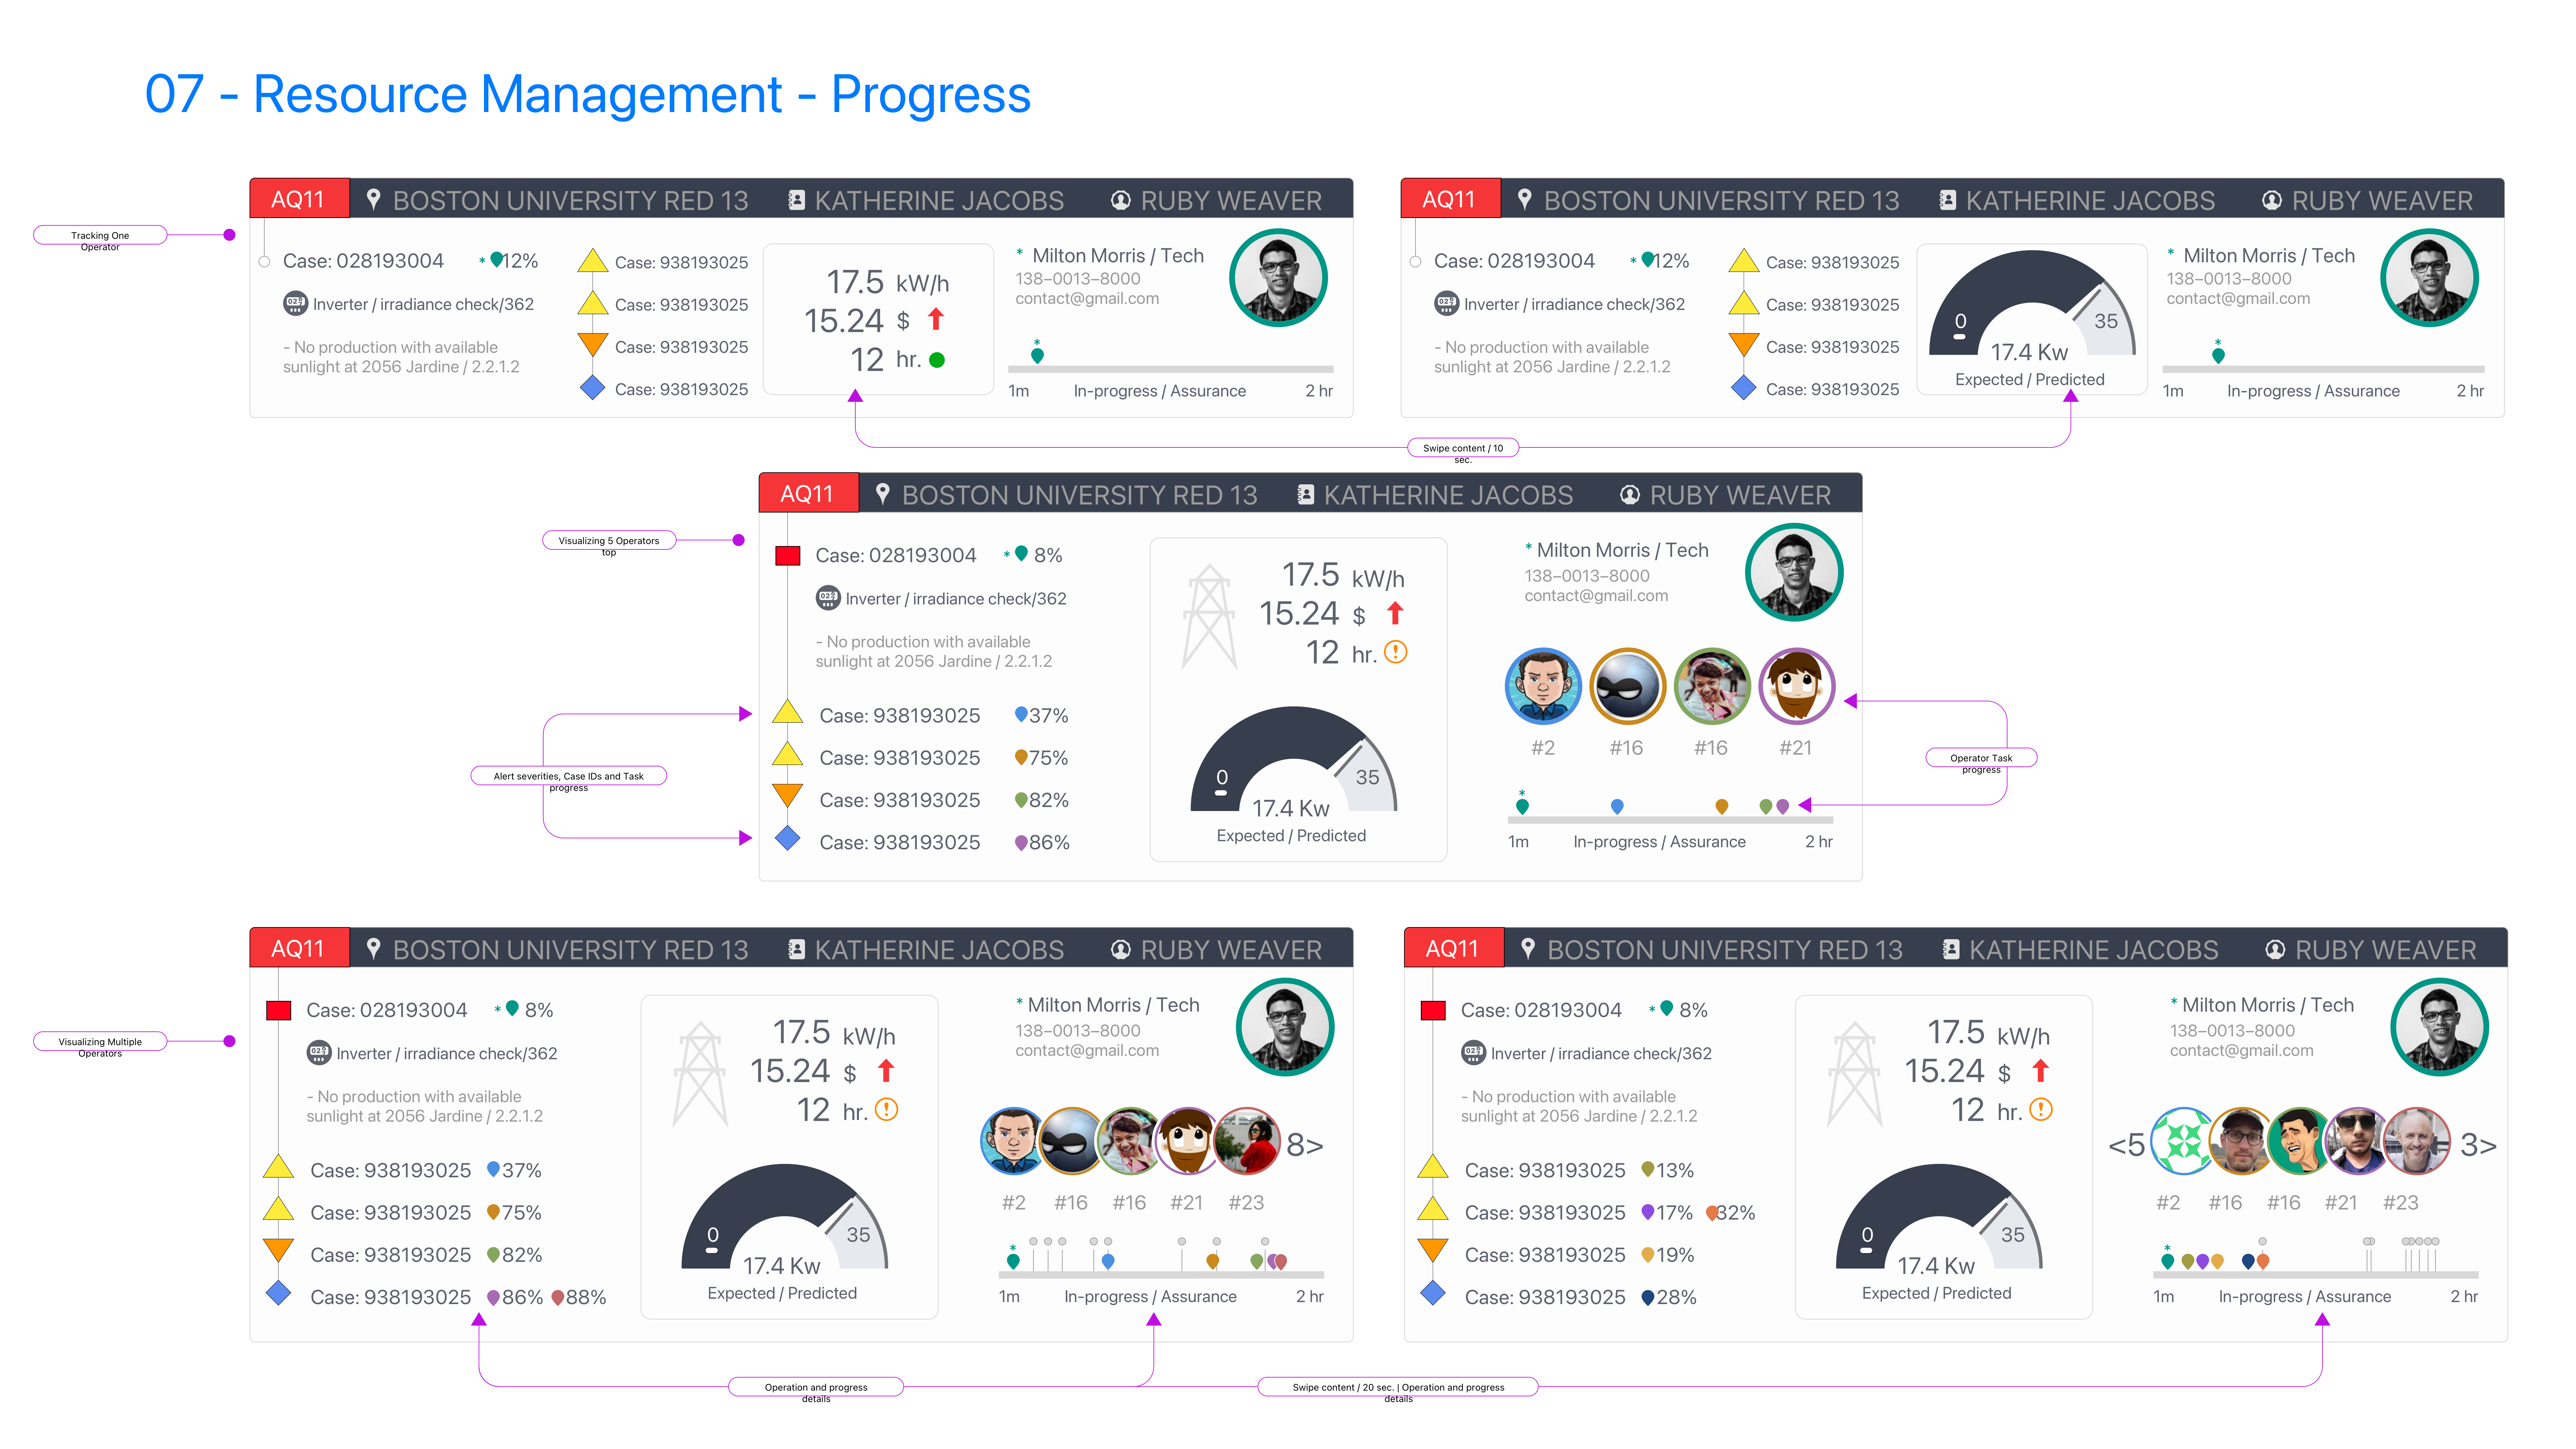
- Modular widget design for alerts, status summaries, device performance, and triage queues.
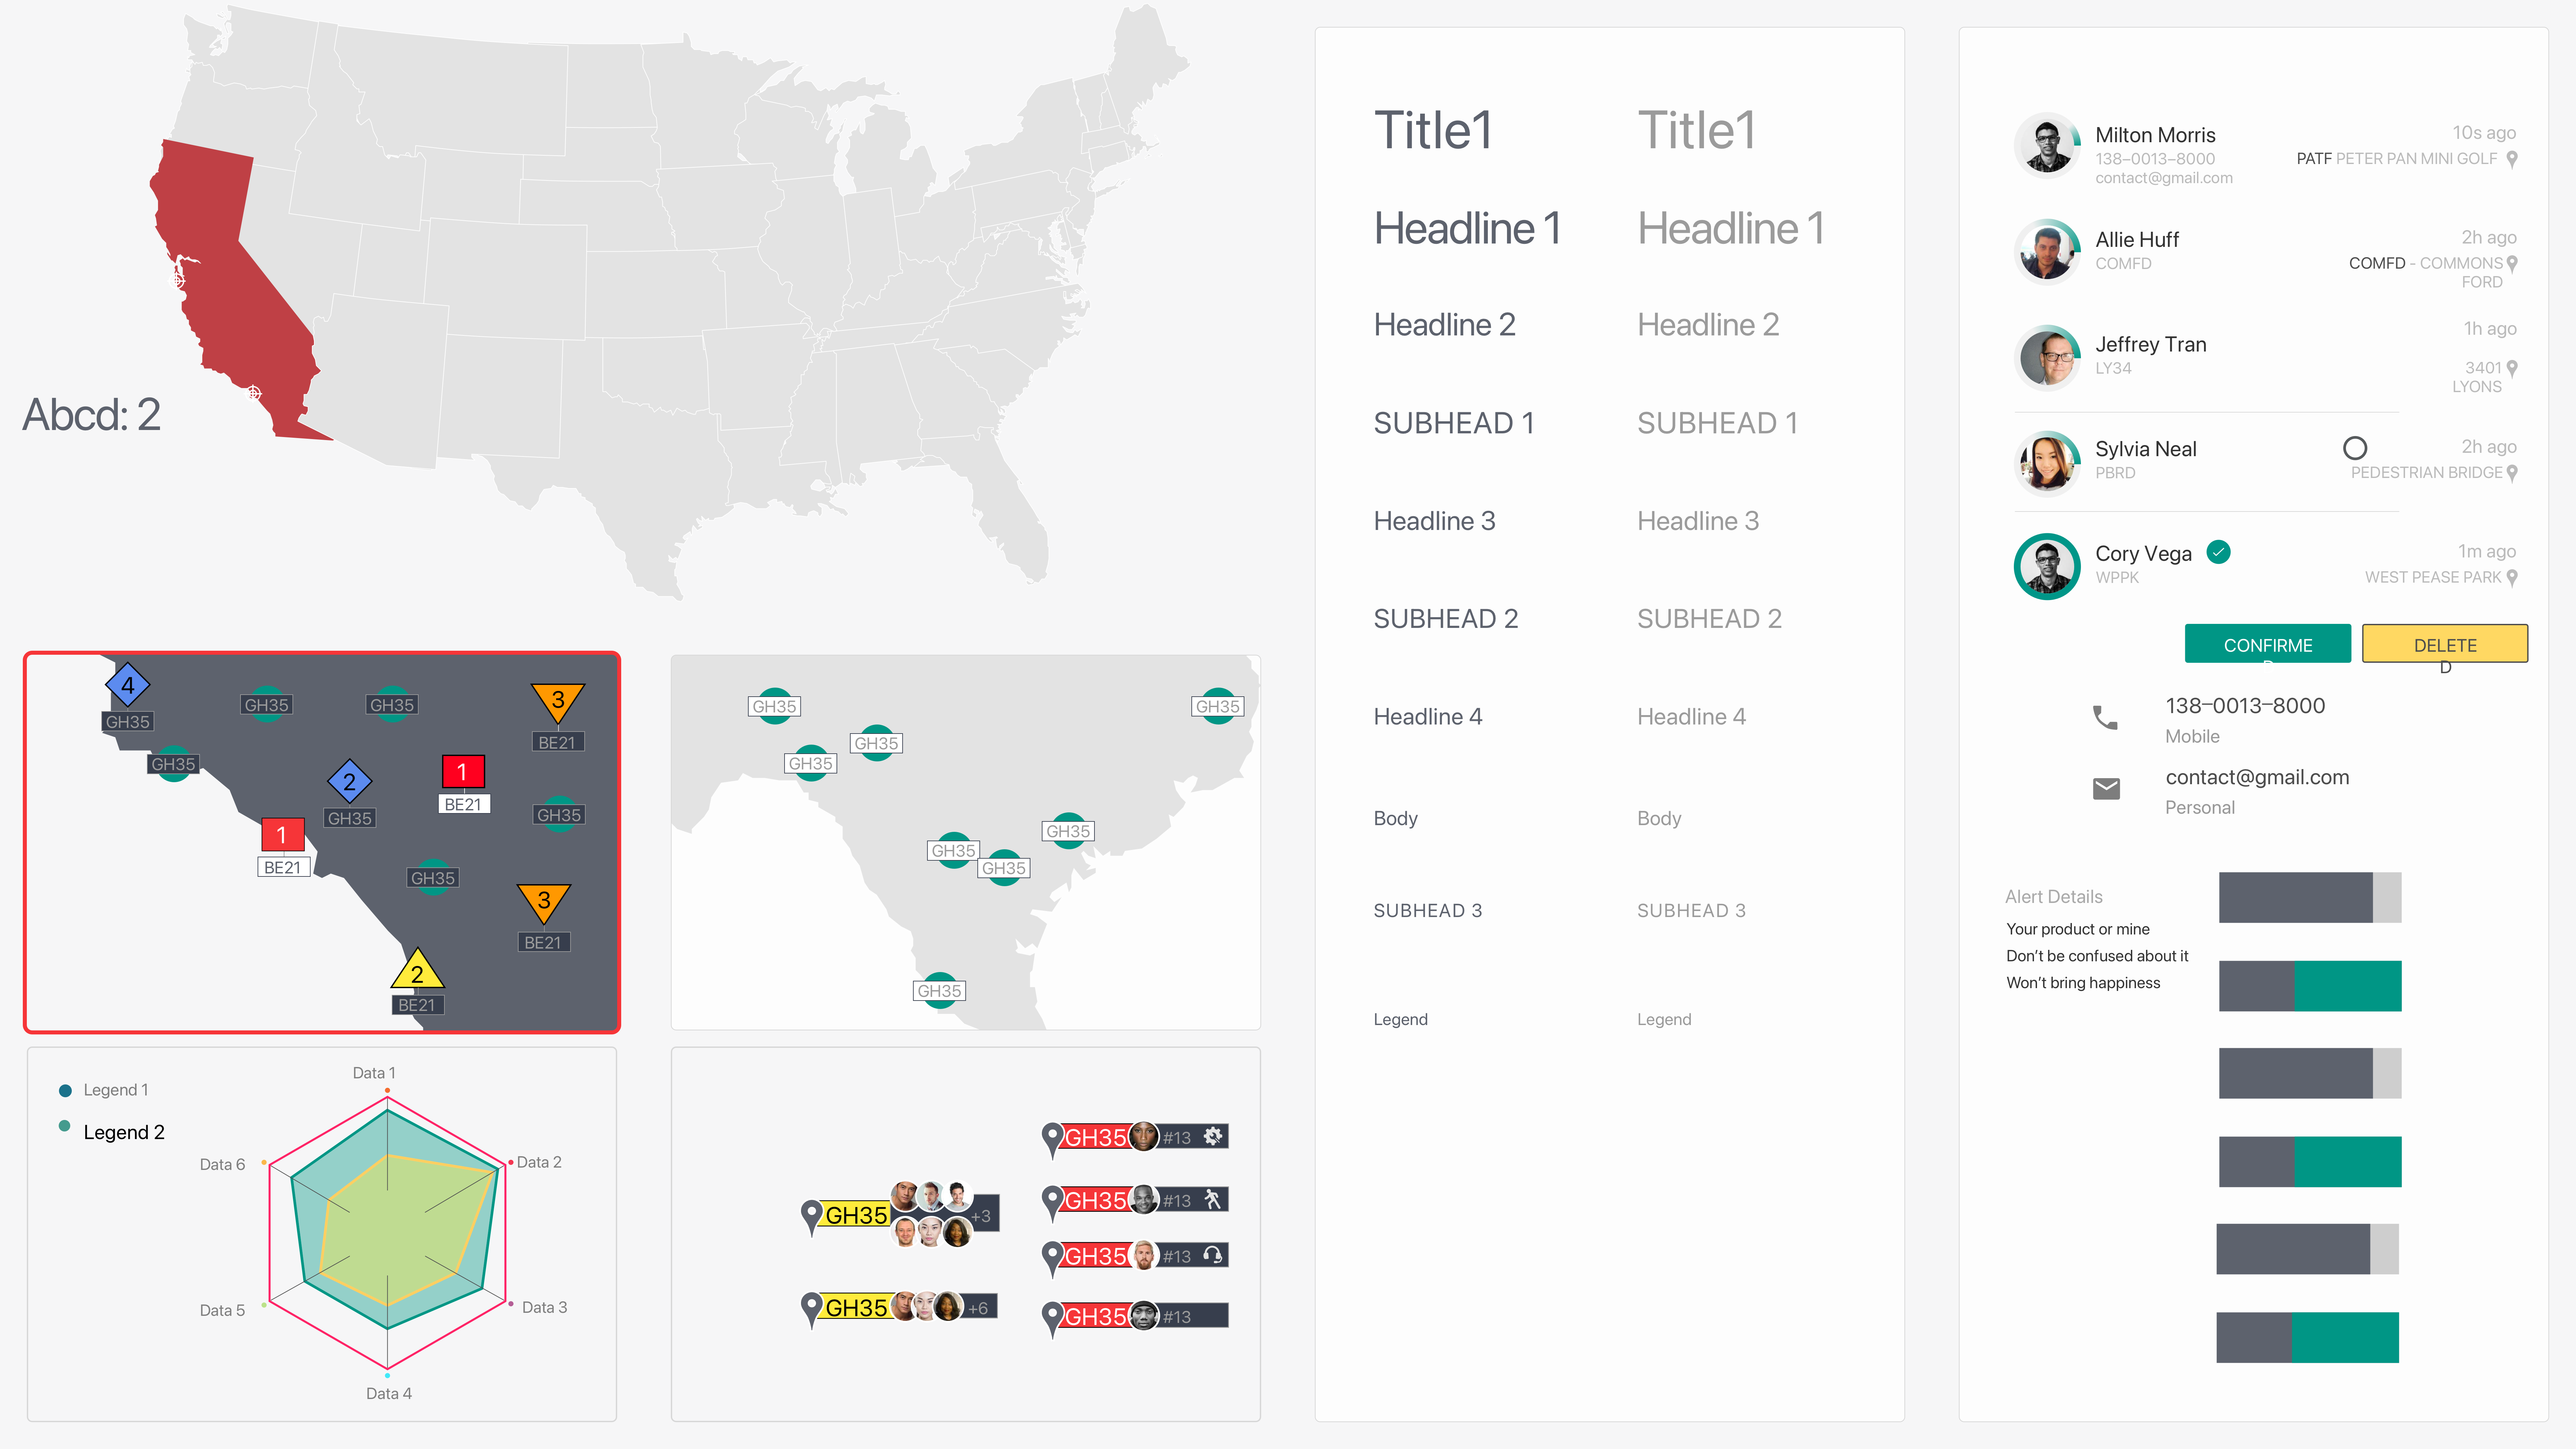
- Wireframing core screens, including dashboards, fault triage boards, alert drill-downs, portfolio overviews, and activity timelines.
Solution
The redesigned PowerNOC experience introduced:
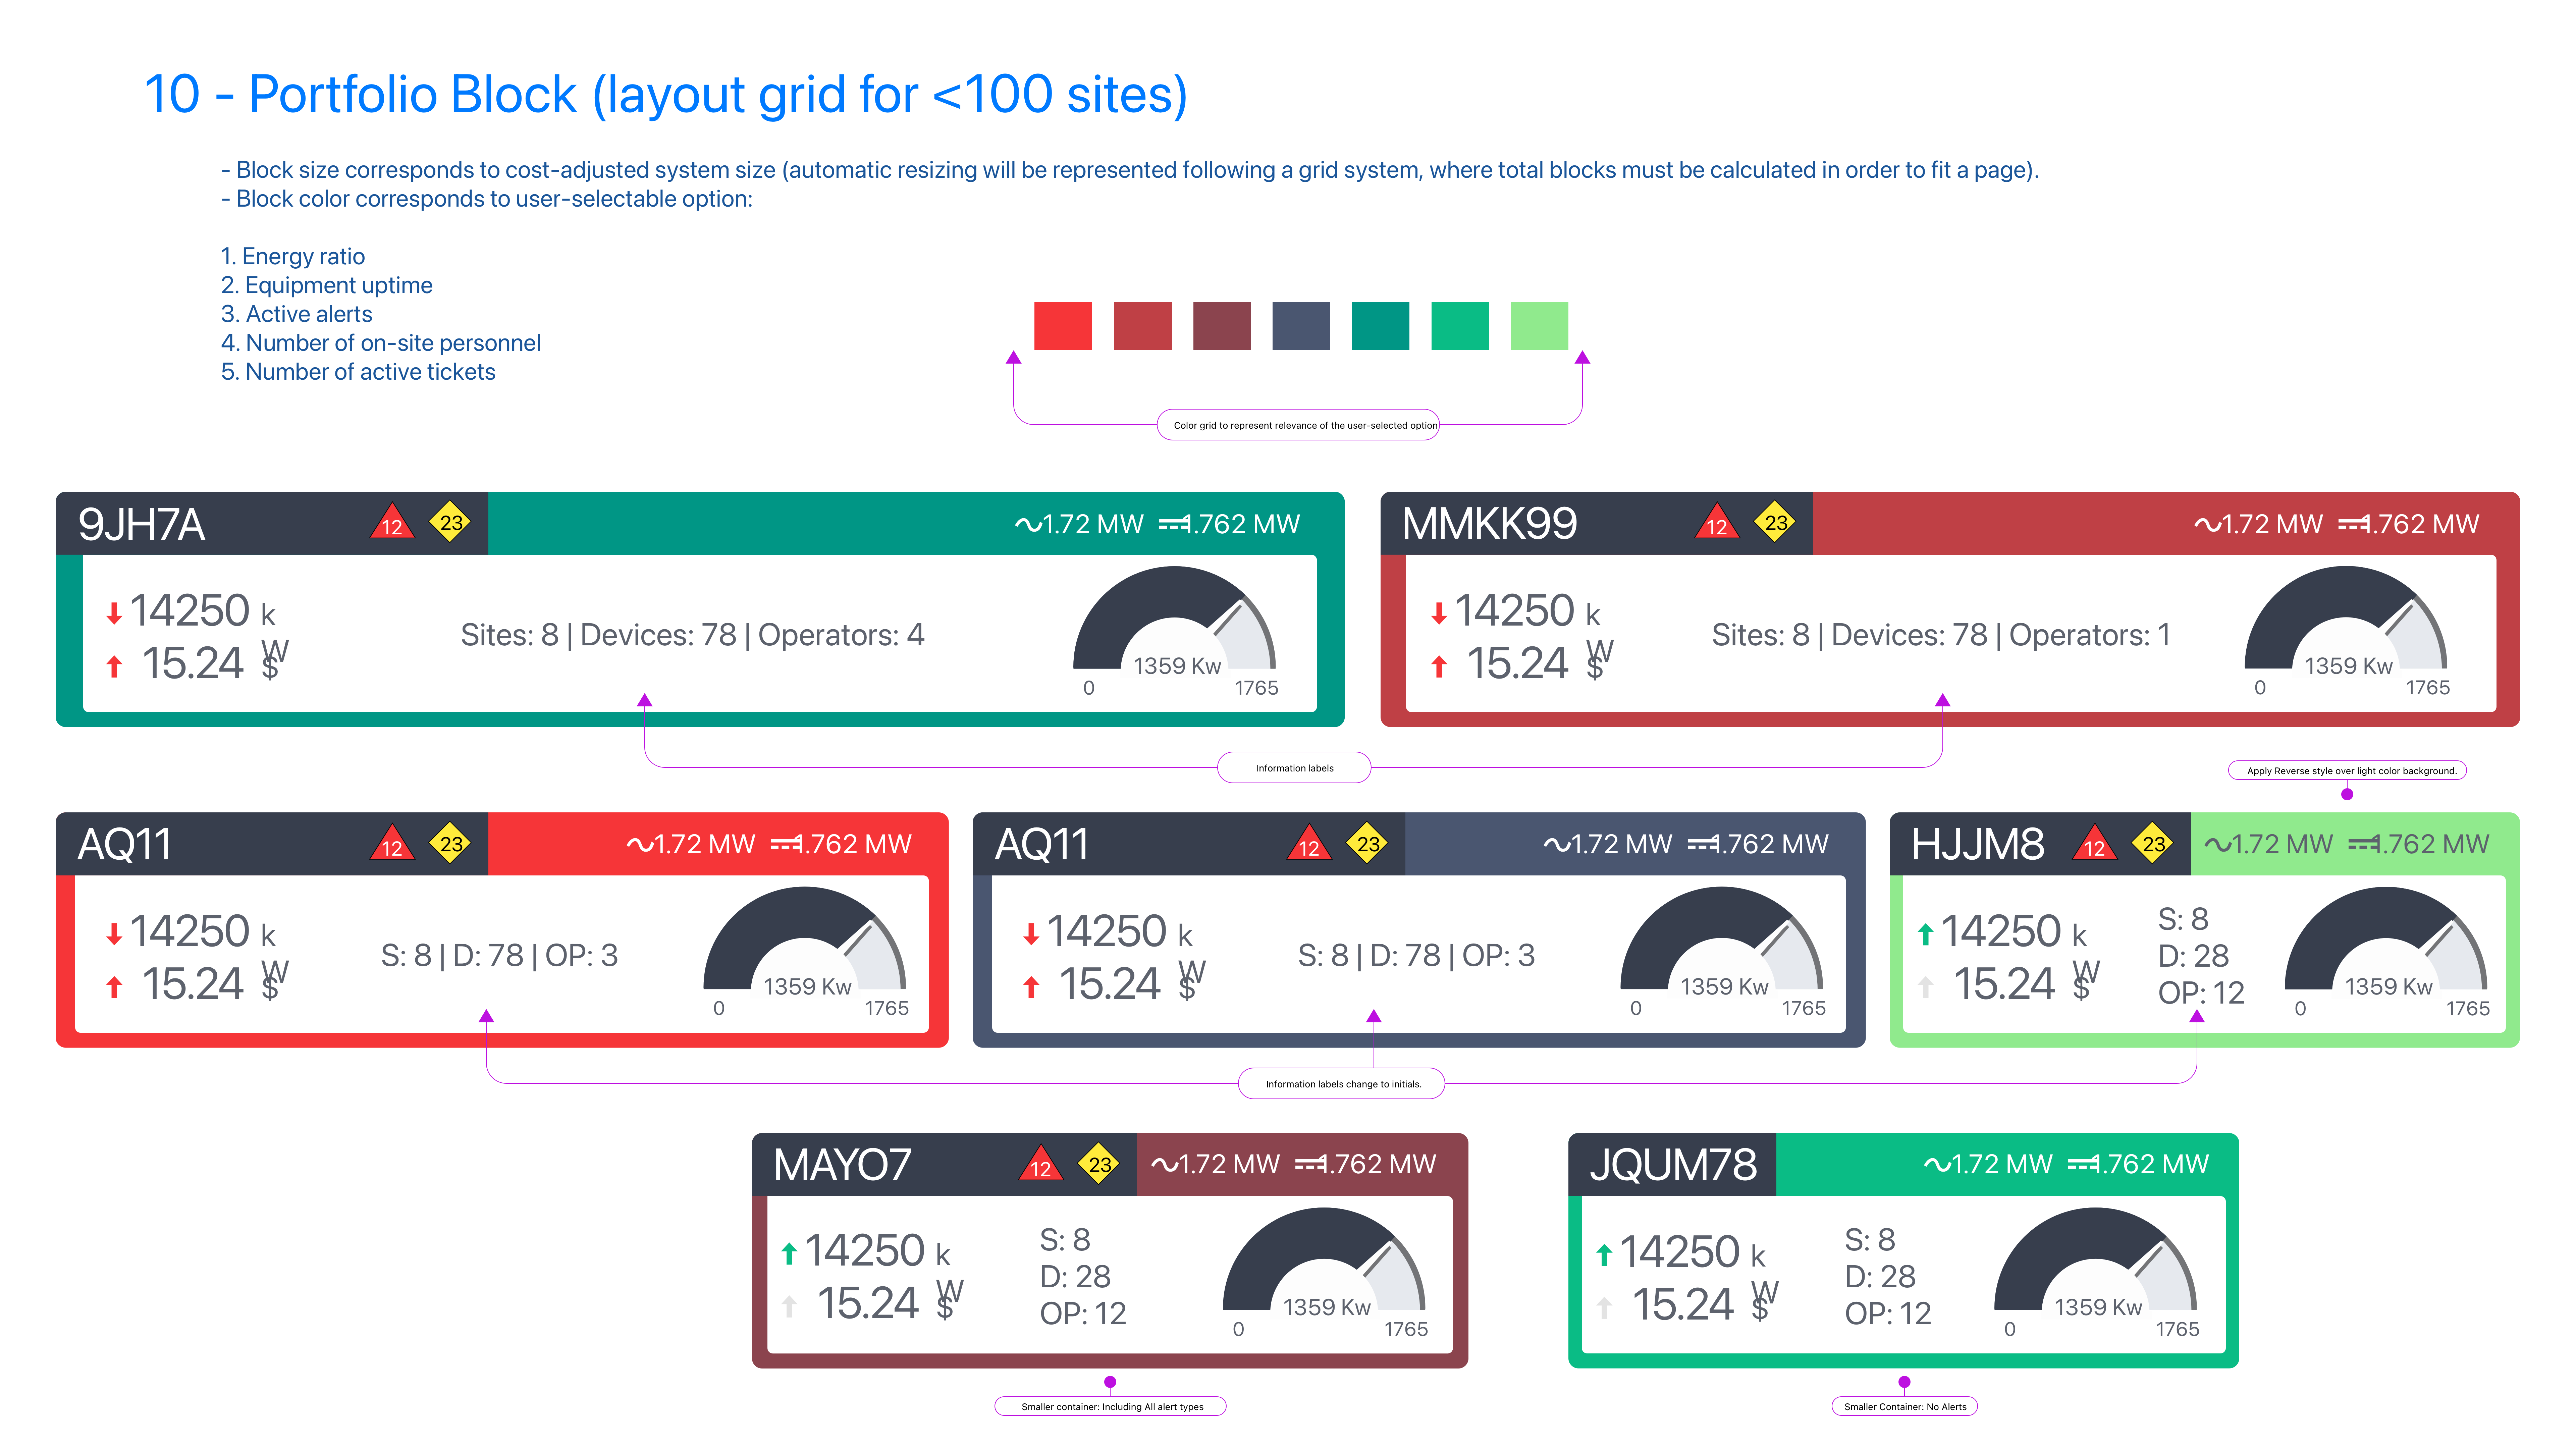
- Adaptive design-system foundation: A lightweight, scalable component library built to function across large NOC display walls, multi-screen operator stations, and standard desktop layouts.
- Unified navigation model: A consistent structural hierarchy that minimized context switching and supported simultaneous monitoring across teams.
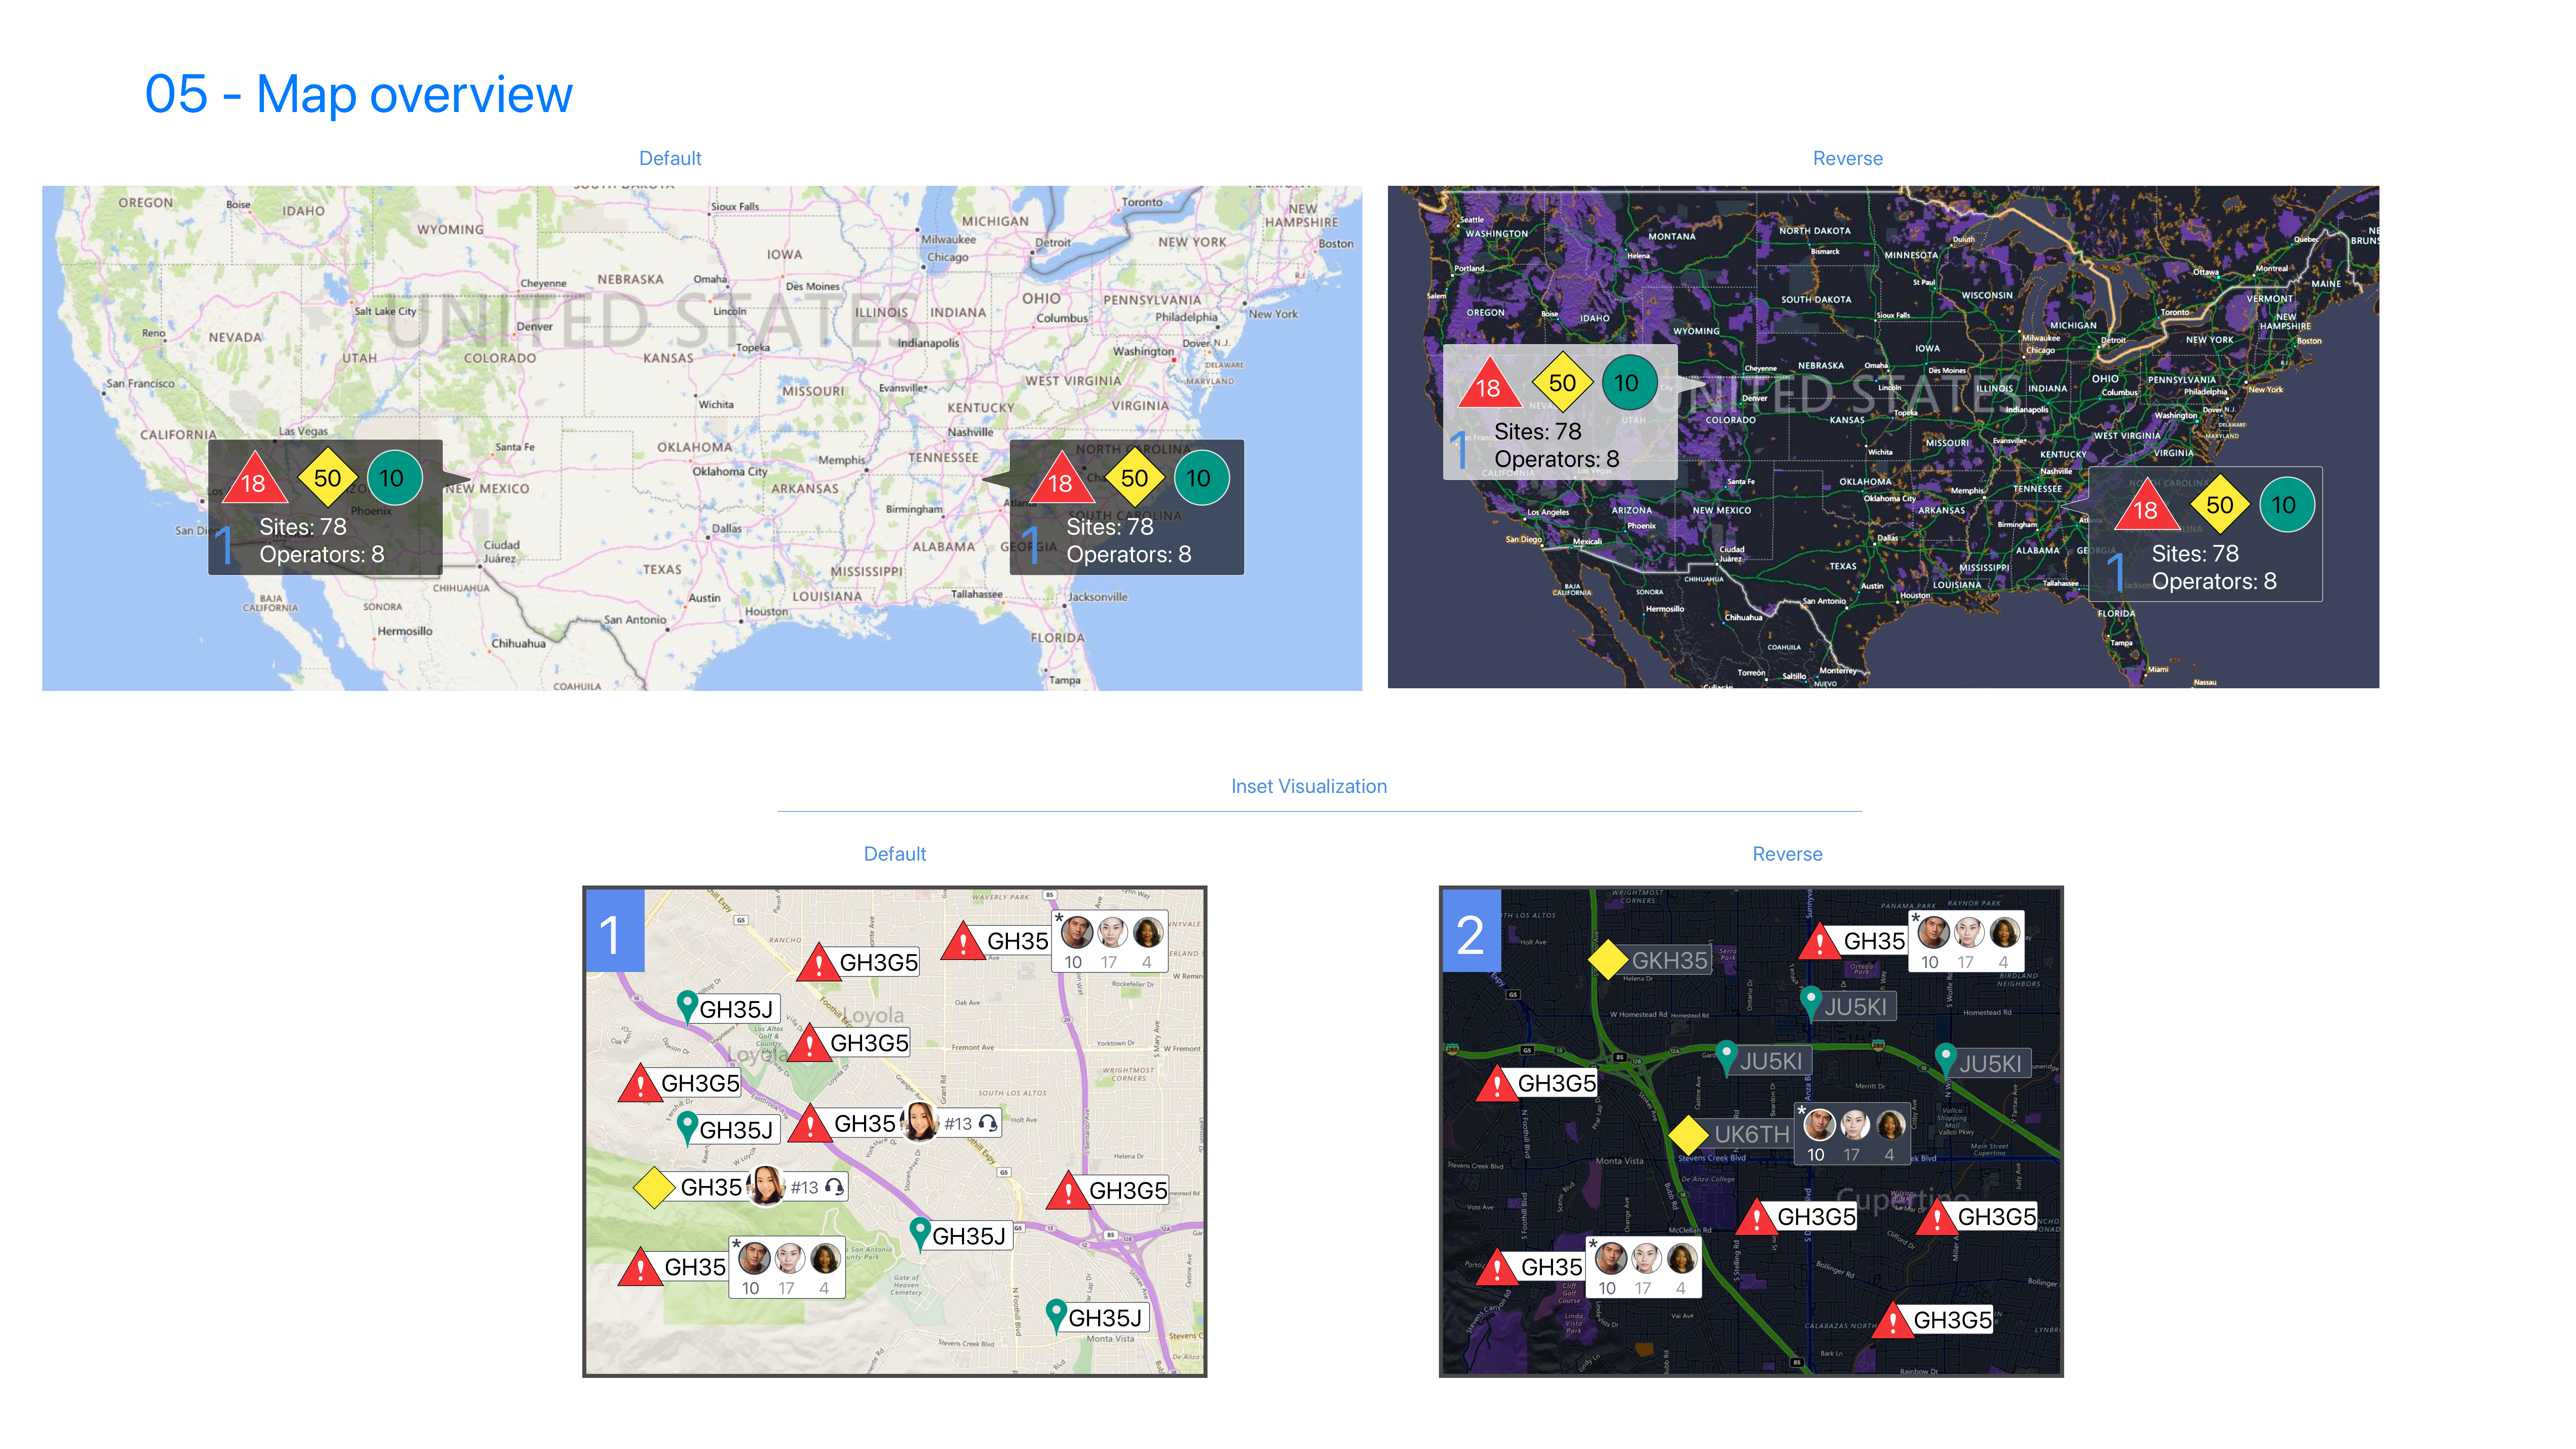
- Prioritized alert hierarchy: Clear visual layers distinguishing critical events, warnings, and routine notifications—optimized for long-distance readability.
- Viewport-responsive layouts: Grid logic tailored for 75"+ displays, tiled multi-monitor setups, and single-user fallback views without sacrificing clarity.
- Accessibility-aligned patterns: High-contrast palettes, predictable interactions, readable typography, and keyboard-friendly behaviors to ensure reliable use during extended operational shifts.
- Standardized interaction patterns: Shared filtering, sorting, and search mechanisms across all data-heavy screens to reduce cognitive load and training time.
- Consistent document workflows: A unified system for document access and viewing, replacing the fragmented behavior found in legacy tools.
- Commercial readiness: A white-label–ready UX architecture capable of supporting future customization for external monitoring organizations.
Results
The redesign delivered:
- A unified UX and UI architecture adaptable to large NOC wall displays, multi-monitor operator stations, and standard desktops.
- A cohesive visual system and modular UI patterns, ensuring consistency across dashboards, triage panels, operator tools, and analytics views.
- Improved fault visibility and reduced cognitive load, enabling faster, clearer decision-making during high-volume monitoring periods.
- A lightweight, scalable design system aligned with accessibility and real-time operational needs, supporting future white-label deployments.
- A production-ready foundation that the engineering team implemented successfully despite limited resources, resulting in a stable internal platform for nationwide renewable-energy operations.
Key Takeaway
For high-stakes operational platforms, clarity and structure matter more than visual polish. Defining the right workflows, data priorities, and scalable UI patterns from the start enables small engineering teams to deliver reliable, multi-screen experiences that support collective decision-making. A well-designed UX + UI foundation becomes the real engine behind operational efficiency and future product expansion.